

Is direct mail still worth the postage?
Postage only goes up, and every budget meeting eventually lands on the same question: is direct mail still worth it? The honest answer is that nobody else's numbers can settle it. Direct mail ROI depends on your list, your offer, and your margins, and the research reviewed for this article contains no reliable benchmark for mail response rates. What it does contain is a measurement toolkit borrowed from paid search and conversion testing: cost-per-action math, holdout groups, incrementality testing, and decision rules set before launch. This article shows how to apply those tools to a mailer, with a QR code as the tracking layer, so you can compute your own cost per customer and decide with data whether the next drop gets funded.
Why Industry Averages Cannot Tell You Whether Your Postage Pays
Search for direct mail response rates and you will find a dozen figures, each from a different year, industry, and definition of 'response.' None of them describes your list. A response rate measured on a national catalog program says nothing about a dental practice mailing a few thousand postcards to one ZIP code.
There is a deeper problem, and it applies to every channel. Sophie Brannon, co-founder of StudioHawk US, writes in Search Engine Journal (November 2026) that a before-and-after comparison tells you something changed, but not what changed. Seasonality, competitor moves, brand campaigns, and tracking errors all push results around at once. Sales rising the month after a mailer does not prove the mailer caused them.
The question that matters, in Brannon's framing, is whether results went up more than they would have without the change. That estimate is called the counterfactual. For direct mail, the counterfactual is simple to describe: what would the households on your list have bought if you had never mailed them? Every method in this article is a way to estimate that number cheaply.
Your takeaway for this section: stop hunting for a universal response rate. Your own baseline, measured on your own list, is the only one that decides your postage budget.
The Cost-Per-Action Formula That Settles Direct Mail ROI
Before testing anything, agree on the metric. Matt Thomas, writing for MarketingProfs about Facebook advertising at Edgar, names cost per action as the metric the Edgar team relies on most: how much, on average, you spend to get the result you want. His example is plain arithmetic. Spend $45, gain 90 likes, and each like costs $0.50.
The same division works for a mailer. Cost per action equals total campaign cost divided by the number of actions. The hard part is defining the action. For direct mail, the useful actions sit close to revenue: a booked appointment, a redeemed coupon, a first order. A scan is a leading indicator, not the finish line.
Here is a hypothetical worked example with round numbers. Say you mail 1,000 postcards at an all-in cost of $1 each, so the drop costs $1,000. Twenty recipients redeem the offer. Your cost per action is $1,000 divided by 20, or $50 per customer. If an average first order carries $80 in gross margin, the mailer paid for itself on the first purchase. If the margin is $30, it did not, unless repeat purchases close the gap.
That last condition matters more for mail than for most channels, because the cost is paid up front and the value arrives over months. Calculate two versions: cost per action against first-order margin, and against 12-month margin per customer. If the mailer only wins on the second, you need a way to follow those customers for a year, which is where tracking comes in.
- Cost per action = total mailer cost / number of actions
- Breakeven test = cost per action is at or below gross margin per customer
- Response rate = actions / pieces delivered x 100
What a Mailer Actually Costs: Fixed Versus Variable Spend
Total campaign cost is more than postage. Split your budget into two buckets. Fixed costs are paid once per campaign: design, copywriting, list cleanup, and setup charges. Variable costs scale with every piece: printing, postage, and list rental per name.
The split changes how you read results. Fixed costs fall per piece as volume grows, so a small test mailing always looks more expensive per piece than the full rollout will. A RAND cost analysis of an education program, Zearn Math in a large Texas school district (published September 2026), shows the same mechanic in a different field: larger schools spread fixed costs across more students, which lowered the per-student cost, and average cost per student fell from $39.02 in year one to $32.48 in year two.
The lesson transfers directly. When you evaluate a test mailing, compute cost per action twice: once with full fixed costs, and once with variable costs plus fixed costs prorated across your planned rollout volume. The first number tells you what the test cost. The second tells you what the channel costs at scale.
Take a hypothetical case. Design and setup cost $400, and variable cost is $0.80 per piece. A 1,000-piece test costs $1,200, or $1.20 per piece. Spread the same $400 across a 10,000-piece rollout and the per-piece cost drops to $0.84. Run this arithmetic with your printer's real quote and your current postage rate before judging the test.
How a QR Code Turns Your Mailer Into a Measurable Test
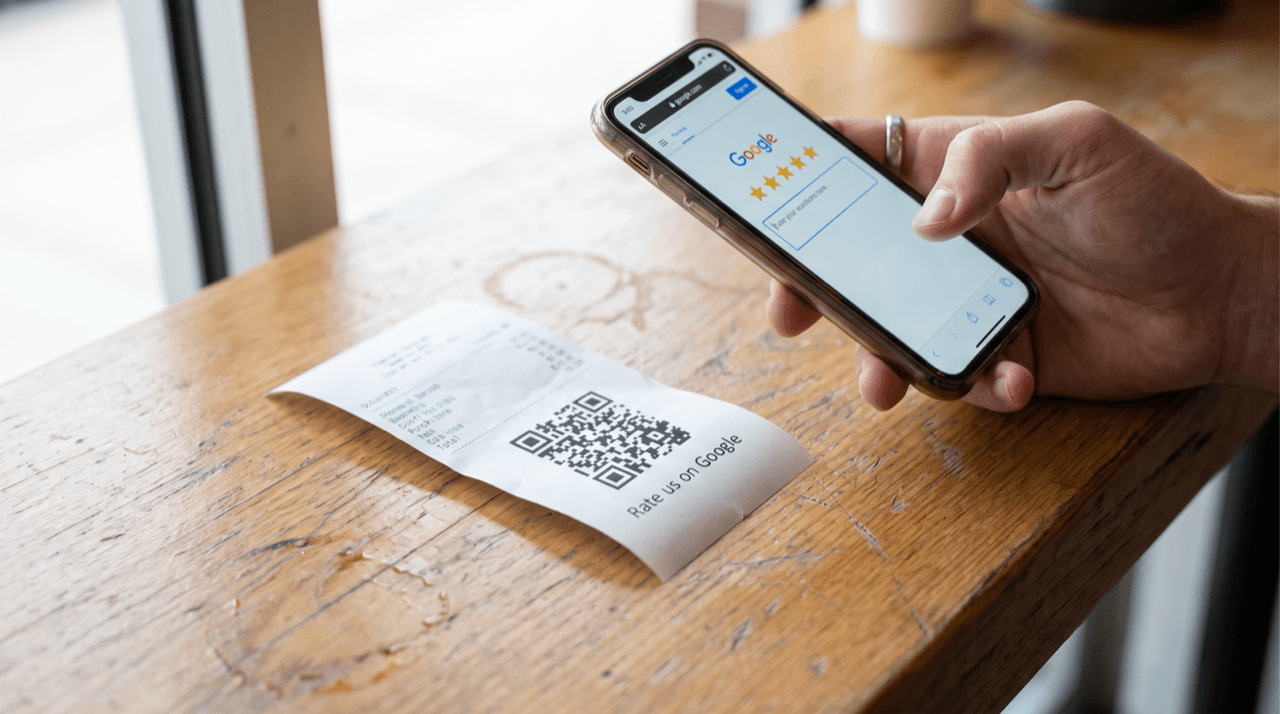
A mailer without a response mechanism is a guess. Phone calls go unlogged, walk-in customers forget where they saw the offer, and online orders land in Google Analytics as direct traffic. A dynamic QR code closes the attribution gap: it points to a short redirect URL that records each scan, and you can change the destination after printing.
The design decision is how many codes to print. Each option trades data against administrative effort, and the right choice depends on what question your test is answering.
- One shared code on every piece. Pro: simplest to print and manage. Con: you learn total scans only, not which segment or creative drove them.
- One code per list segment, such as past customers versus a rented list. Pro: shows which audience responds. Con: requires a separate print version per segment.
- One code per creative variant. Pro: isolates the effect of a headline or offer. Con: only valid if every other element stays identical.
- One code per household through variable data printing. Pro: ties every scan to a named recipient for 12-month value tracking. Con: highest print and data-handling cost.
Pair Every Code With a Landing Page and a Backup Response Path
Point each code at a landing page built for that mailer, and pass a campaign parameter into Google Analytics so visitors who convert days later still carry the mailer's label. Without the parameter, a recipient who scans on Monday and buys on Friday from a laptop shows up as an unrelated visit.
Print a short offer code next to the QR code as well. Some recipients will type a URL or call instead of scanning, and those responses belong in your count. Log phone redemptions against the same offer code so every response path feeds one total.
Keep in mind that scans measure attention, not purchases. Treat scan count as the top of the funnel and the redemption or order as the action in your cost-per-action formula. If scans are strong and redemptions are weak, the problem sits on the landing page or in the offer, not in the envelope.
Use a Holdout Group to Measure Lift, Not Coincidence
Tracking tells you who responded. It does not tell you who would have bought anyway. A loyal customer who orders every month will scan your postcard and order again, and the QR code will credit the mailer with a sale it did not create.
The fix is a holdout group: randomly set aside a slice of your list and do not mail them. Then compare purchase rates between the mailed group and the holdout over the same dates. The difference is the incremental lift, and it is the number your postage has to pay for. This is the direct mail version of what Google calls incrementality testing.
Incrementality testing used to be an enterprise tool. According to Search Engine Land (November 2025), Google cut the minimum budget for incrementality tests in Google Ads from about $100,000 to $5,000, and says its new statistical models make results up to 50% more conclusive. Google positions incrementality as one piece of a measurement framework alongside Marketing Mix Models (MMMs) and attribution: MMMs show the cross-channel picture, incrementality provides causal data on specific campaigns, and attribution connects touchpoints to outcomes.
A mailer supplies all three layers if you set it up correctly. The QR code and offer code handle attribution. The holdout handles incrementality. Your monthly sales trend across channels becomes raw material for a mix model later.
Here is a hypothetical illustration. Mail 9,000 households, hold out 1,000, and track both groups for 60 days. If 3% of the mailed group buys and 2% of the holdout buys, only the one-point difference counts as mail-driven. On 9,000 pieces, that is 90 incremental customers, not 270 total buyers. Divide your campaign cost by 90, not 270.
How Many Responses Do You Need Before You Trust the Result?
Small numbers mislead. A gap of a handful of orders between the mailed group and the holdout is often random variation, and acting on it means scaling a mailer that never worked.
A MarketingProfs reader exchange on split testing walks through one standard check, a chi-squared test, using a web page example: Version A drew 2,010 clicks from 4,550 views (44%) and Version B drew 1,750 clicks from 4,510 views (39%). The method compares what each group actually did against what you would expect if both versions performed identically. The respondent also notes that 95% confidence is customarily ample for most marketing work.
You can run the same check on mailed versus holdout households with a spreadsheet and the steps below. Plan the size of each group before you mail, not after. If your expected response rate is low, a small mailing produces too few responders to separate signal from noise, so run fewer, larger tests rather than a string of tiny ones.
- Add total responses across both groups and divide by total households. In the MarketingProfs example, 3,760 clicks divided by 9,060 views gives an expected rate of 0.415.
- Multiply each group's size by that rate to get its expected responses. In the example, 4,550 x 0.415 gives about 1,888.
- For each group, square the difference between actual and expected responses, then divide by the expected value.
- Add those values. The MarketingProfs example sums to 15.834. Compare your total against a chi-square table at your chosen confidence level.
Reading Small Mail Tests: Certainty Versus Likelihood
Even a well-built test often ends with an ambiguous answer, and this is where two schools of statistics split. Frederick Vallaeys, writing in Search Engine Land (December 2025), explains the difference for marketers. Classic A/B tests are frequentist: they rely on p-values, defined as the probability of observing a result if nothing changed, and ask whether a result reached statistical significance. At the budget levels many advertisers can realistically afford, Vallaeys writes, those tests often fail to produce conclusive results.
Bayesian methods ask a different question: given what you already know, how likely is this to be true? They start from a prior (what the system believes before the test), update it into a posterior (the belief after observing data), and report a credible interval, the range where the result likely falls. Vallaeys credits this Bayesian-style approach for Google's ability to keep tests useful when the budget sits closer to $5,000 than $100,000.
For a mailer, the practical move is to report a range rather than a single number. Brannon makes the same point in Search Engine Journal: 'Clicks are up 14%' invites an argument, while 'the model puts the lift between 8% and 19%' is much harder to argue with. If your range for incremental cost per customer sits entirely below your margin per customer, mail again. If the range straddles your margin, run a second, larger drop before committing the annual budget.
Write the Decision Rule Before the First Envelope Ships
Brannon lists four things behind a result that holds up in front of a finance team: a fair comparison, a range instead of a single number, a business outcome, and a decision rule set before the test starts. She calls the last one the step most teams skip. Choose what counts as a win after seeing the data, and you will always find a way to call it a win.
Jason Shafton, founder and CEO of Winston Francois, describes the same discipline in Search Engine Journal (July 2026). A clean test, he writes, moves one variable against a real control, runs to a sample size fixed before starting, and keeps a guardrail on the number you refuse to harm. He also warns against test sprawl: an AI model will hand you 200 ideas, and the real work is choosing the five that count this quarter.
For direct mail, a one-page brief covers it. Sign it before the print order goes out. It turns the postage debate from opinion into arithmetic.
- Hypothesis: what this mailer should change, for example 'a first-order discount brings lapsed customers back.'
- Primary metric: incremental cost per customer, mailed group versus holdout, over a fixed window such as 60 days.
- Guardrail: a number that cannot drop, such as average order value or margin per order.
- Decision rule: the threshold that triggers a rollout, a second test, or cancelling the channel.
- One variable: change the offer or the creative, never both in the same drop.
Direct mail is worth the postage when its incremental cost per customer sits below what that customer is worth to you, and no industry benchmark can calculate that for your list. The measurement methods Google now offers advertisers at small budgets (holdouts, lift, credible ranges) work just as well on paper as on screens. This week: pull your next mailing list, randomly set aside 10% as a holdout, print a unique dynamic QR code and offer code for the mailed group, and write a one-page brief with your breakeven cost per customer. After 60 days, divide total campaign cost by incremental customers, not total customers. That single number tells you whether the next drop gets funded.
Start measuring your own campaigns
QRlytics tracks every scan with location, device, and browser data, so you can see which printed pieces actually pay off. The free plan covers your first codes at no cost, and Pro unlocks unlimited dynamic codes and full scan history when you are ready to scale. See all options on the plans page.

Ready to track your QR codes?
Create trackable QR codes with powerful analytics. See who scans, when, and where. All in real-time. Get started for free today.