
Do your package inserts drive repeat orders?
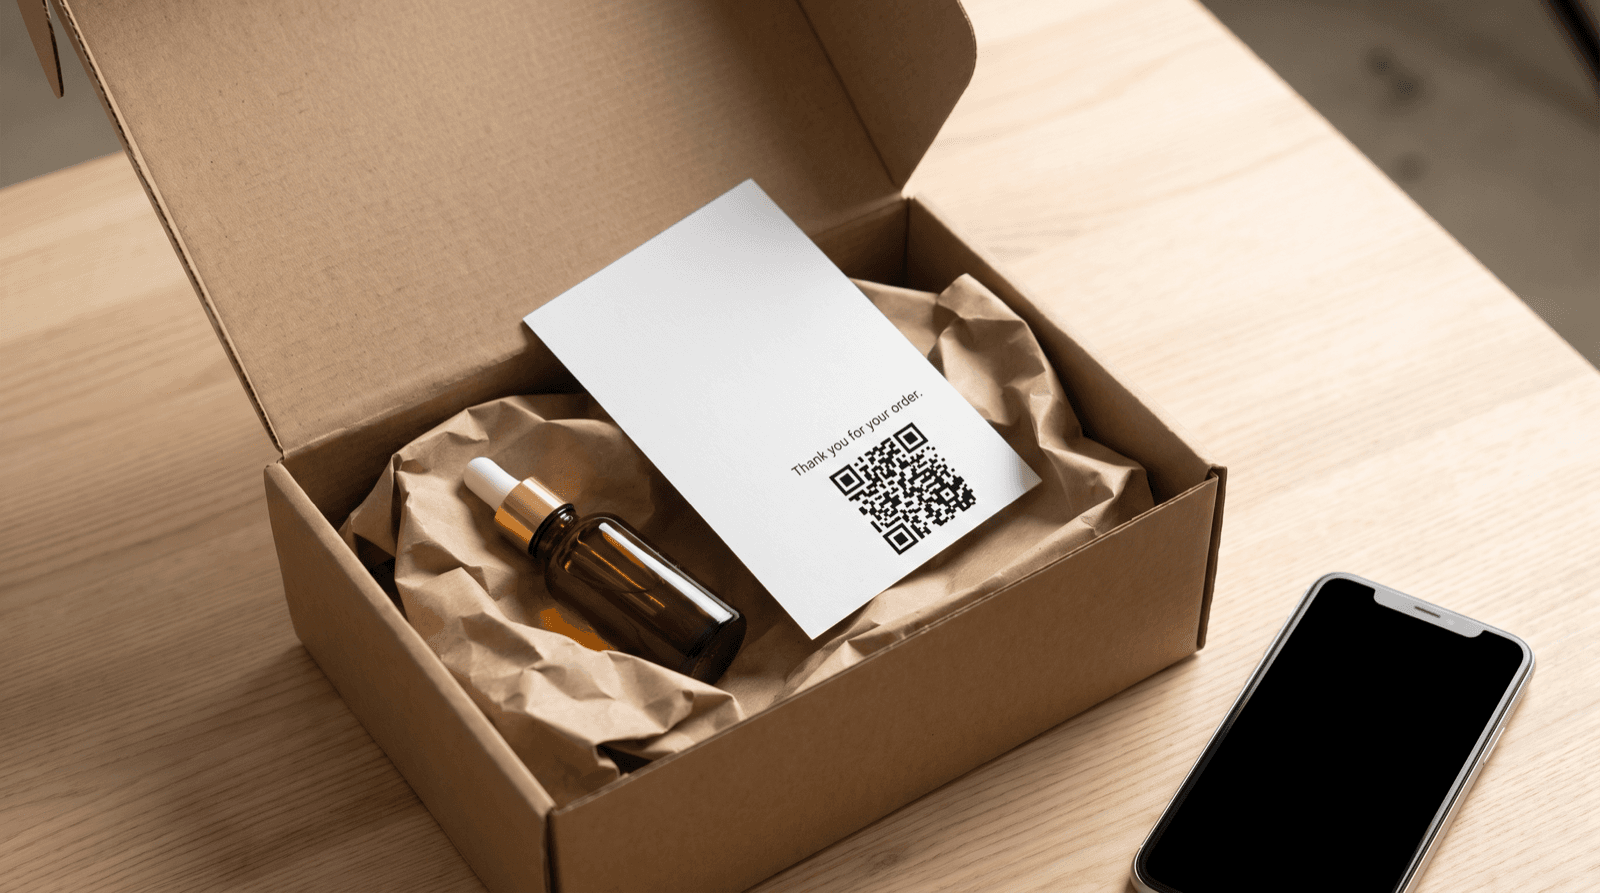
Every order you ship carries a free ad slot: the card or flyer tucked between the product and the packing paper. Most brands fill it. Few measure it. Package inserts reach a customer at the one moment they are guaranteed to look, yet they rarely appear in a revenue report. With eCommerce now a $6.8 trillion industry on track to reach $8 trillion by 2027 (SellersCommerce data cited by The Marketing Agency), competition for that second order keeps rising, and guessing is expensive. This guide shows how to connect a QR code on your insert to actual repeat purchases, which three metrics to track, how to run a holdout test that reveals the lift scan data misses, and when to keep, change, or kill an insert.
Why Package Inserts Are the Least Measured Channel in Your Store
An insert gets something no ad buys: a few seconds of undivided attention while the customer opens a box they paid for. That moment is also where your product gets judged. Ahrefs' 2024 breakdown of CarMats.co.uk, a UK store that hit £1M in sales within 9 months of its May 2020 launch and has since turned over about £9M, lists 'ship quality products from day one' as one of six core takeaways. The unboxing is where that quality promise is confirmed or broken, and your insert sits right in the middle of it.
The trouble is attribution. A printed card has no click, no cookie, and no pixel. When a customer reorders three weeks later by typing your URL, nothing in your analytics connects that purchase to the card in their first box. So inserts get filed as a packaging cost rather than a marketing channel, and nobody asks whether the print bill earns anything back.
Retention is clearly movable. The Marketing Agency's roundup of 25 ecommerce case studies reports that Sephora's AI-driven personalization campaigns boosted repeat purchases by 40%. That result came from digital campaigns, not paper inserts, and it says nothing about what a card in a box will do for your store. No source in this review measured insert-driven repeat order rates directly. That gap is exactly why you need to measure your own.
Define a Repeat Order Before You Print a Single Insert
Vague goals produce vague data. Before the design file goes to the printer, write down what a win looks like in numbers. For most stores, that means three metrics, each measured inside a fixed attribution window. The figures below are illustrative, chosen to keep the math simple.
- Scan rate: scans divided by inserts shipped. If you ship 1,000 orders and 50 customers scan, your scan rate is 5%. This tells you whether the insert gets noticed, nothing more.
- Scan-to-repeat conversion: repeat orders placed through the insert's tracked link divided by scans. If 10 of those 50 scanners reorder, that is 20%. This tells you whether the offer and landing page work.
- Repeat order rate per shipment: all second orders from the cohort that received the insert, through any channel, divided by orders shipped. This catches customers who saw the card but came back through Google or a bookmark instead of scanning.
Pick the Attribution Window From Your Own Order History
Choose the window based on your real reorder cycle, not a round number. A consumable product reorders on a short cycle; a furniture store measures in months. If the median gap between first and second orders in your store is 45 days, a 30-day window will miss most of the reorders the insert influenced.
Pull that median from your store admin or export before you launch, then add a buffer of a week or two. Write the window down and do not change it mid-test. Moving the goalposts after the data arrives is the fastest way to convince yourself a weak insert works.
Static vs. Dynamic QR Codes on Package Inserts: Which Gives You Attribution?
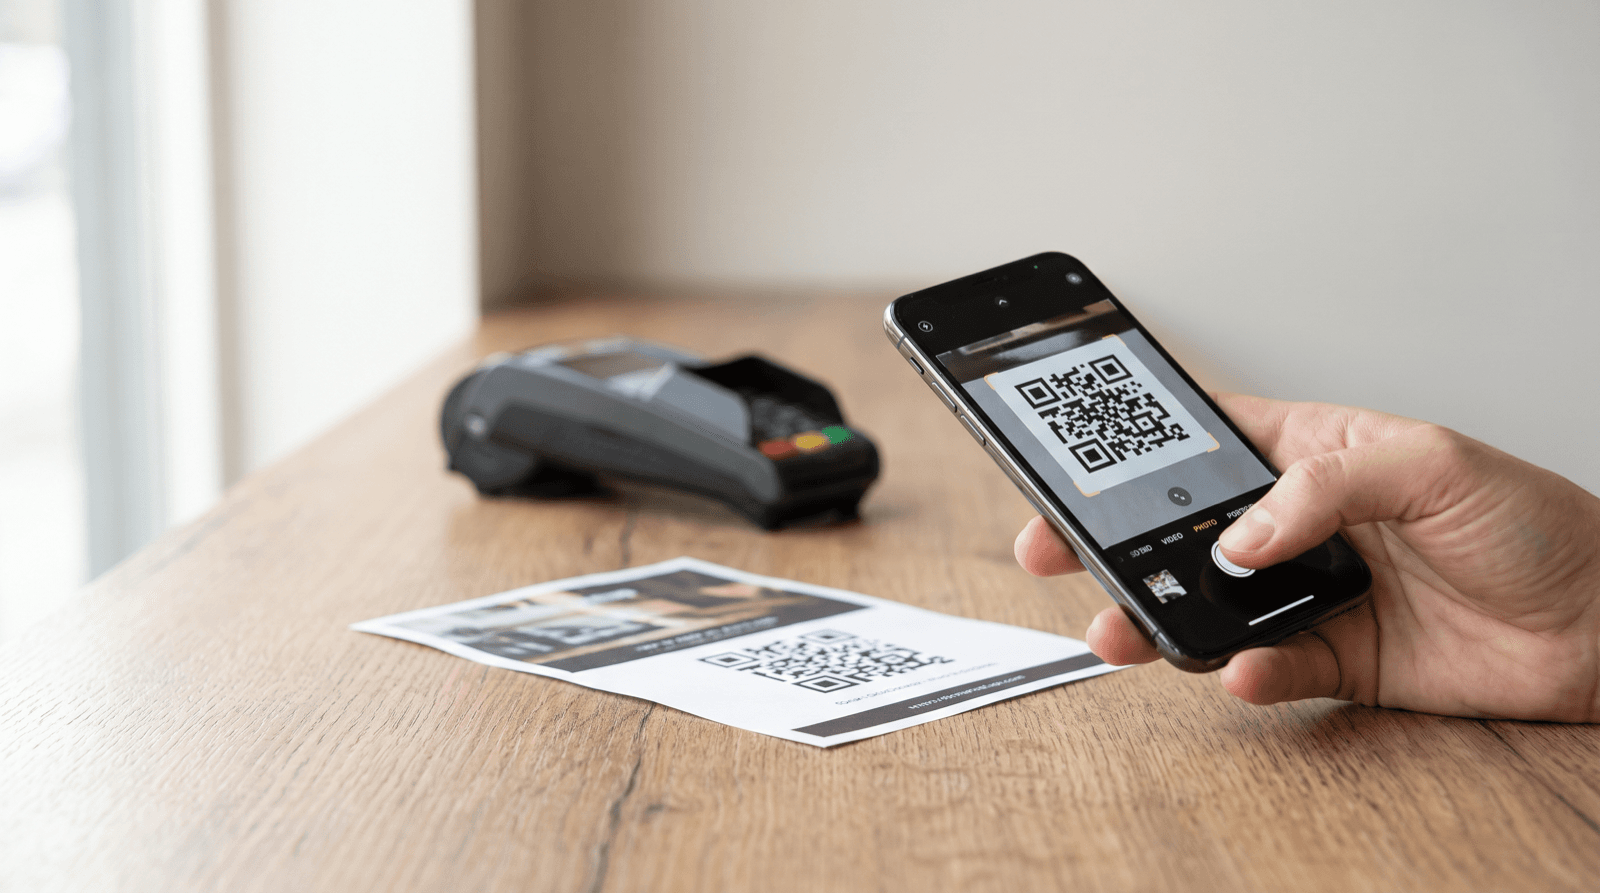
A static QR code encodes the destination URL directly in its modules. Once printed, it cannot change, and it records nothing on its own. A dynamic QR code encodes a short redirect URL, so you can change the destination after printing, and the redirect logs each scan with time, device, and location data.
For inserts, the ability to edit matters more than most teams expect. Insert stock often sits in a warehouse for months. If your reorder offer expires or your product page moves, a static code on a carton of 5,000 printed cards points to a dead page. A dynamic code gets updated in a minute.
Three setups cover most stores, each trading simplicity for detail:
- One shared code on every insert. Pro: one print run, one design, lowest cost. Con: you learn whether the insert works overall, but not which product, cohort, or offer drove the reorder.
- One code per product line. Pro: shows which first purchases lead to reorders, useful for cross-sell decisions. Con: more print versions and more packing rules for the fulfillment team.
- One code per offer variant. Pro: a clean A/B comparison between two offers on the same customer base. Con: needs volume; with 200 orders a month split two ways, a test takes a long time to say anything reliable.
How to Connect an Insert Scan to a Repeat Purchase in GA4
Scan tracking tells you someone scanned. It does not tell you they bought. Closing that gap takes three layers: the QR code, a tagged landing URL, and working ecommerce tracking on your store.
Start with Urchin Tracking Module (UTM) parameters on the destination behind your dynamic code, for example utm_source=insert, utm_medium=qr, and a utm_campaign value named after the variant. Every session that starts from a scan then carries its own source in Google Analytics 4 (GA4), and revenue from those sessions stays separate from organic and email traffic.
Then confirm your purchase tracking actually records orders. Search Engine Journal's GA4 ecommerce guide, built around a Shopify example, notes that a Google Tag Manager (GTM) container alone is not enough for ecommerce reports. A store needs a purchase data layer that passes revenue, tax, and shipping details, set up in four steps: add the code to the checkout page, create a custom event, create a data layer variable, and create a new tag in GTM. The same guide points out that GTM is free and does not require a developer on staff.
Three GA4 features from that guide help here: no data sampling in standard reports, attribution that is not limited to last click, and a funnel builder in Explorations. Use the funnel builder to chart scan session, landing page view, add to cart, and purchase as one path, so you see exactly where scanners drop off.
One last filter: a repeat order means the buyer already exists in your records. Match purchase emails from insert-tagged sessions against your first-order list, in your store admin or your Customer Relationship Management (CRM) system, so a friend who scans a gifted box does not inflate your repeat numbers.
Walk Through the Scan Path Before 1,000 Inserts Ship
Most insert failures have nothing to do with the offer. They come from friction between the card and the checkout: a code that opens a desktop-only page, a discount that does not apply automatically, or a login wall in front of the reorder button.
HubSpot describes a cheap way to catch this: the cognitive walkthrough. Participants new to a product complete a set of tasks while researchers record each action, then compare the results against the 'happy path,' the scenario where nobody hits a roadblock. HubSpot notes the method is cost-effective and that employees from other departments can stand in for customers, so no outside panel is required.
For an insert, the happy path is short: open box, see card, scan, land on a reorder page, apply the offer, pay. Hand three colleagues a sealed sample box and their own phones, ask them to reorder, and note every hesitation. HubSpot's process runs to seven steps, starting with a defined goal and ending with recorded results. Set your goal as a completed reorder within a fixed time, such as 60 seconds.
Mobile quality is non-negotiable, because every scan lands on a phone. The Marketing Agency's case study roundup credits ASOS with a 35% conversion increase from making its mobile pages usable. Test your reorder page on at least one iPhone and one Android device before the print run, not after.
What Offer Belongs on a Repeat Order Insert?
The insert's offer is the value exchange: why should the customer scan now instead of tossing the card with the packing paper? 'Follow us' gives no reason to act. A specific, time-bound offer tied to the product just received does.
Keep the choice small. The Marketing Agency's roundup reports that Basecamp doubled conversions by cutting its pricing options from 4 to 2. An insert that carries a discount code, a referral link, a review request, and a newsletter signup asks the customer to make four decisions at once. Pick one action per insert.
Make the reorder itself frictionless. In a 2017 Moz case study, footwear company Protalus increased direct sales by 91% in about 6 months through one-click upsells and conversion rate optimization (CRO). That was an on-site funnel, not an insert, but the principle transfers: fewer steps between intent and purchase means fewer abandoned purchases. A scan that lands on a prefilled cart with the discount applied beats a scan that lands on your homepage. Three offer types fit most stores:
- Replenishment reorder: a link to a prefilled cart for the same item. Best for consumables with a predictable usage cycle.
- Complementary product: a link to the one item your order data shows customers most often buy second. Best when a clear pairing exists.
- Subscription conversion: a link to a subscribe-and-save page. Best when you already run subscriptions and want first-time buyers in that funnel.
A Worked Example: Reading Your First Insert Test
Here is a hypothetical run, with round numbers chosen to show the math, not to set a benchmark. Say you ship 2,000 first orders in a month. Half get an insert with a dynamic QR code; the other half get no insert and serve as a holdout group.
In the insert group, 100 people scan, a 10% scan rate. Of those, 20 place a second order through the tagged link within your 60-day window, a 20% scan-to-repeat conversion. On scan data alone, the insert produced 20 repeat orders.
Now check the holdout. Suppose 60 of the 1,000 no-insert customers reorder within 60 days (6%), while 90 of the 1,000 insert customers reorder through any channel (9%). The true lift is 30 extra repeat orders, not 20, because 10 customers saw the card and came back later without scanning. Scan tracking undercounts insert influence, and only a comparison group reveals the gap. Run a two-proportion significance test before declaring a winner; a 3-point gap on groups of 1,000 clears a standard test, but the same gap on groups of 200 does not.
Finally, price it. If each insert costs $0.20 to print and pack, 1,000 inserts cost $200. Divided by 30 incremental reorders, that is about $6.67 per extra repeat order. Compare that figure with your average second-order margin. If the margin is higher, the insert earns its slot.
Segment Inserts by Customer Cohort, Not Just by Campaign
Not every first-time buyer reorders for the same reason. A Darden School of Business case published in March 2024 describes Flipkart executives who, after onboarding the company's first 200 million customers, had to work out how to attract and retain a next cohort that was younger, had less disposable income, and shopped very differently. The same logic holds at small-store scale: a customer who bought an entry-level product on discount is not the customer who paid full price for a premium bundle.
Dynamic codes make cohort splits cheap. Keep one insert design, assign a separate code to each segment, such as discount-driven first orders and full-price first orders, and have the fulfillment team pack the matching card. After 2 to 3 months, compare scan-to-repeat conversion by cohort. If full-price buyers reorder at twice the rate, your insert budget belongs in their boxes.
When to Keep, Change, or Kill a Package Insert
An insert is a test, not a tradition. Set the decision rules before results arrive so a weak number does not get explained away.
- Keep it if incremental repeat orders, measured against the holdout, cost less than your average second-order margin. Reprint with the same code and offer.
- Change the destination if the scan rate is healthy but scan-to-repeat conversion is low. The card is doing its job; the landing page or offer is not. Swap the URL behind the dynamic code without reprinting.
- Redesign the card if the scan rate is low. That points to size, contrast, position in the box, or a call to action with no reason to scan. Change one variable per print run.
- Kill it if two consecutive test periods show no measurable lift over the holdout, and move the print budget to a channel you can prove. Also check data retention: the QRlytics free tier keeps 30 days of scan history, so if your attribution window runs 60 days, export scan data before it rolls off.
Package inserts are one of the few channels guaranteed to reach a customer who has already paid you. Whether they drive repeat orders is not a matter of opinion; it is a measurement you can complete in one reorder cycle. Put a dynamic QR code on the card, tag the destination with UTM parameters, confirm GA4 records purchases through a working data layer, and hold back an untreated group so you see the full lift, not just the scans. This week: pull the median days between first and second orders from your store data, set that as your attribution window, and split your next 1,000 shipments into insert and no-insert groups. When the window closes, calculate cost per incremental reorder and keep, change, or kill the insert based on that single number.
Start measuring your own campaigns
QRlytics tracks every scan with location, device, and browser data, so you can see which printed pieces actually pay off. The free plan covers your first codes at no cost, and Pro unlocks unlimited dynamic codes and full scan history when you are ready to scale. See all options on the plans page.

Ready to track your QR codes?
Create trackable QR codes with powerful analytics. See who scans, when, and where. All in real-time. Get started for free today.