

Does your flyer budget pay for itself?
Flyer ROI is the question most marketers quietly avoid, because for decades there was no honest way to answer it. You print a stack of flyers, hand them out, and watch sales for the next few weeks. If revenue ticks up, the flyers worked. If it does not, maybe the design was wrong, or the timing, or the weather. That guessing game is over. A tracked QR code turns a printed flyer into a measurable channel, which means you can finally calculate whether your flyer budget pays for itself or quietly drains your marketing spend. This article walks through the exact math, the tracking setup, and the one trap that makes most print ROI numbers lie.
Why Flyers Have Always Been a Leap of Faith
For most of print advertising's history, marketers justified the spend with a sentence Lenkli sums up well: it must be working, look at our sales. Print lived on faith. The traditional ways to connect a printed piece to a result were all weak. How-did-you-hear-about-us surveys depend on customer memory and get low response. Unique phone numbers per campaign cost money and demand maintenance. Coupon codes only capture the people who convert, not the wider audience who saw the flyer and did nothing. Regional sales correlation is noisy and lags by weeks. According to Lenkli, none of these methods were good, and all of them required significant inference to connect print spend to outcomes.
That measurement gap is not a small problem. It is why flyer budgets get cut first when money gets tight: nobody can defend a line item they cannot measure. And the discipline problem runs deeper than print. According to the Content Marketing Institute, in its 2025 B2B benchmarks conducted with MarketingProfs, 58% of marketers rate their content strategy as only moderately effective, and nearly half of those blame a lack of clear goals. Marketing without measurement is the default, not the exception.
The flyer itself was never the weak link. The missing piece was a reliable way to trace a physical touchpoint to a digital outcome.
What Flyer ROI Actually Means, and How to Calculate It
Flyer ROI is a ratio, not a vibe. In plain terms: take the revenue (or better, the gross margin) the campaign produced, subtract what you spent to design, print, and distribute the flyers, then divide by that spend. A result above zero means the batch paid for itself. Below zero means it cost you money to run.
Work an example with round numbers so the mechanics are clear. Say you spend $400 to print and distribute 2,000 flyers, which works out to $0.20 per flyer. At a 4% scan rate, 80 people scan the code. If one in eight of those scanners buys a $50 product, that is 10 sales and $500 in revenue. Subtract the $400 print cost and the batch cleared $100, a 25% return. This is a hypothetical to show the formula, not a benchmark; your real scan rate and conversion rate will differ.
One honest adjustment matters here. Revenue is not profit. If that $50 product carries a 40% gross margin, the 10 sales contributed $200 in margin, not $500, which turns the tidy 25% return into a loss once print costs come out. Run the calculation on margin, not top-line revenue, or the number will flatter you. That single swap is where most back-of-envelope flyer math goes wrong.
The QR Code Turns Print Into a Measurable Channel
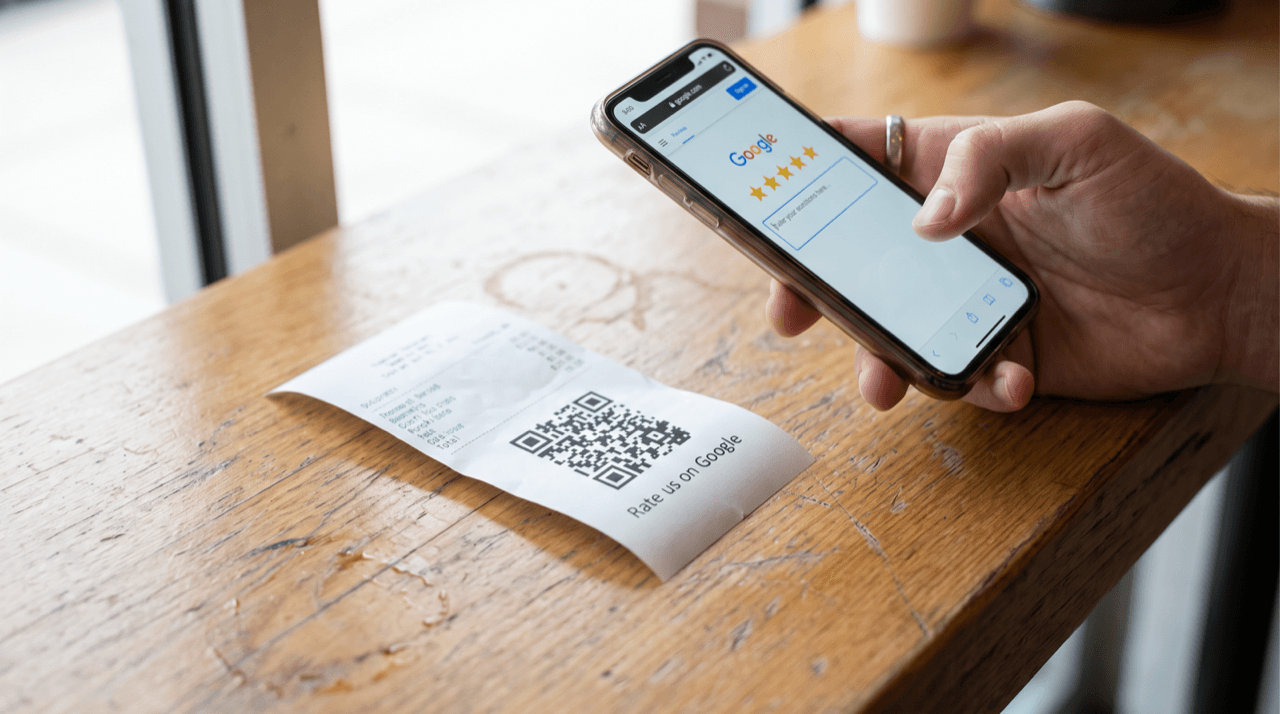
A tracked QR code closes the gap that surveys and coupon codes never could. According to Lenkli, every flyer, poster, and magazine ad can now carry a scan-tracked QR that feeds attribution back to a specific placement, using the same logging pipeline that powers digital link tracking. The mechanics are straightforward: the scan event is captured with a timestamp, location, and device; UTM (Urchin Tracking Module) parameters carry the campaign metadata through to the destination page; and the analytics on that page attribute conversions back to the exact print asset that drove them.
The result is that a printed flyer generates the same quality of data you expect from a digital ad. Lenkli puts the cost contrast bluntly: a tracked flyer can cost roughly 10% of the digital equivalent while producing a comparable attribution trail. Whether that ratio holds for your business depends on your print and media rates, but the direction is right. Print stopped being the cheap-but-blind option.
Use a dynamic QR code rather than a static one for this. A dynamic code routes through a short redirect URL you control, so you can change the destination after printing, send the same flyer to different landing pages, and read scan analytics per code. A static code bakes the URL into the pattern permanently, which means no tracking layer and no second chances once the flyers are in the wild.
Correlation Is Not Payback: The Incrementality Trap
Here is the trap that makes most flyer ROI numbers lie. When a scanner buys, you record a conversion and credit the flyer. But some of those buyers were already your customers. They would have purchased anyway, flyer or no flyer. Counting them as flyer-driven revenue inflates your return and hides whether the campaign actually changed behavior.
This is the difference between correlation and incrementality. According to Gartner, incrementality measurement platforms exist precisely because clicks and last-touch attribution capture activity that would have happened anyway. To isolate true causal impact, these platforms run controlled experiments: geo-tests, audience splits, and synthetic control models that measure the incremental lift a campaign actually generated rather than the traffic it merely intercepted.
You do not need an enterprise platform to apply the logic. The small-business version of a geo-test is a holdout. Distribute flyers in one neighborhood or at one location and deliberately skip a comparable one, then compare sales in both over the same window. The gap between them is far closer to your real incremental return than raw scan counts will ever be. It is more work than reading a scan dashboard, and it is the difference between knowing your flyers pay for themselves and assuming they do.
Most marketers never run the holdout. That is exactly why their reported print ROI looks better on paper than in the bank.
How Granular Should Your Tracking Be?
The value of your attribution data depends on how granular your codes are. Lenkli lays out four levels, from coarse to fine, and the right one depends on your campaign volume and how much admin you can absorb.
One tradeoff runs through every level: finer granularity buys sharper decisions at higher production and management cost. A single-location shop testing one flyer design does not need per-recipient codes. A brand placing flyers across a dozen partner venues learns nothing useful from a single shared code. Match the granularity to the decision you actually need to make.
- Level 1, one code per campaign: the same QR on every asset. It answers whether the print campaign drove scans at all, but not which flyer or placement worked. Fine for a small, single-format run.
- Level 2, one code per asset type: separate codes for flyers, posters, and magazine ads. Now you can see which format earns the most scans, which is enough to reallocate next quarter's print budget.
- Level 3, one code per placement: a distinct code for the flyer at the cafe, the salon, and the gym. According to Lenkli, this is what serious marketers do, because it exposes which partner placements actually perform.
- Level 4, unique code per print run: variable-data printing generates a personalized URL per recipient. It offers person-level attribution but costs the most to produce, so it is usually reserved for B2B direct mail where each lead's value justifies the expense.
Scans Are Not the Only Conversion
Scan-to-purchase on a landing page is the clean case. Plenty of flyer conversions do not look like that. A prospect scans your code, reads the offer, then calls to book or fills in a form days later. If your measurement only counts what happens on the scan page, those conversions vanish and your flyer ROI reads artificially low.
This is where call and form tracking closes the loop. According to Semrush, CallRail attributes leads to their original marketing source and gives visibility into the customer journey across both online and offline touchpoints, which lets teams optimize offline ad campaigns for higher ROI. A unique tracking number or a form tied to the flyer's landing page connects a phone call back to the printed piece that started it.
For a service business, a home contractor, a dentist, a salon, this matters more than the scan count itself. The scan is the top of the funnel; the booked job is the return. Attribution that stops at the scan measures interest, not income. Wire the phone number and the form into the same campaign tag as the QR code, and your ROI calculation finally reflects money, not clicks.
Set a Baseline Before You Judge the Numbers
A single flyer run rarely gives you a verdict you can trust. The number you get needs context, and that context is a baseline. Treat your first tracked campaign as a measurement to compare everything against, not a pass-fail grade. If a batch of 1,000 flyers returns 40 scans, that 4% scan rate becomes your reference point. The number itself is illustrative; what matters is that you now have one.
Two habits protect you from reading noise as signal. The first is sample size. Ten scans and one sale tell you almost nothing, because the counts are too small to separate a real effect from luck. Wait until you have a few hundred scans before you trust a conversion rate. The second is a fixed measurement window. Decide up front that you will count scans and conversions for, say, 30 days after distribution, then hold to it, so you are not quietly moving the goalposts when the early numbers look thin.
With a baseline set, change one variable at a time. Test a bigger code, or a different offer, or a new placement, but not all three at once, or you will never learn which change moved the number. Compare each new batch against your baseline, keep the winners, and retire the designs that underperform. That is how a flyer program compounds instead of merely repeating.
What the Measurement Itself Costs
Every measurement layer has a price, and the honest question is whether the data is worth more than the setup. This is the same calculus the ANA describes for bringing marketing capabilities in-house: there is no one-size-fits-all answer, and you weigh the initial investment against the savings, judging whether the control and insight you gain justify the cost.
For flyer tracking, the investment is modest. Dynamic QR codes, UTM tagging, and a landing page with analytics sit within reach of any small marketing budget, often at the free or entry tier. The heavier cost is discipline: naming conventions kept consistent, codes mapped to placements in a spreadsheet or dashboard, and someone actually reading the numbers after the campaign ends. The tooling is cheap. The habit is where teams fail.
Weigh it against the alternative. An untracked flyer run is a bet you can never grade. A tracked one tells you, batch after batch, which designs, offers, and placements earn their keep, so the next print order gets smarter instead of larger. The measurement pays for itself faster than the flyers do, because it stops you from reprinting the losers.
So, does your flyer budget pay for itself? Until you put a tracked code, a tagged landing page, and a holdout comparison behind it, the honest answer is that you do not know, and neither does anyone still running blind print. The tools cost little; the discipline to use them is the real investment. This week, pick your next flyer run and build it to be measured: put one dynamic QR code on it, point that code at a landing page with analytics, and hold back one comparable location or neighborhood as a control. When the campaign closes, calculate the return on gross margin rather than revenue, and compare the tracked area against the holdout. That one number, grounded in a real experiment, is worth more than a year of it must be working.
Start measuring your own campaigns
QRlytics tracks every scan with location, device, and browser data, so you can see which printed pieces actually pay off. The free plan covers your first codes at no cost, and Pro unlocks unlimited dynamic codes and full scan history when you are ready to scale. See all options on the plans page.

Ready to track your QR codes?
Create trackable QR codes with powerful analytics. See who scans, when, and where. All in real-time. Get started for free today.