

Your gut says Downtown. Your data disagrees.
You already have a favorite. Ask any operator which location performs best, and the answer comes fast: Downtown. It has the foot traffic, the flagship signage, the energy. Then you pull the QR location data, and the scans tell a different story. The quiet suburban spot you almost cut is converting at a much higher rate. This is the uncomfortable gap between what you feel and what your codes record. This article walks through how to build QR location data you can trust, how to read it without flattering your assumptions, and how to make placement decisions that survive a second look.
Why Your Gut Overweights the Location You See Every Day
Intuition is not random. It is pattern recognition built from whatever you happen to observe most. Downtown wins in your head because you drive past it, you see the crowd, and you remember the busy Saturday. The suburban location gets a quieter mental file simply because you spend less time there. Psychologists call this an availability effect: the examples that come to mind easily feel more true, whether or not they are.
Foot traffic makes this worse. A crowded location produces more raw activity, so it feels productive even when very little of that activity converts. Volume and value are different measurements. A spot that draws a big crowd and converts a handful is losing to a spot that draws fewer people and converts more of them, but the first one looks alive and the second one looks sleepy.
There is also a sunk-cost pull. If Downtown carries your flagship lease and your best signage, admitting it underperforms feels like admitting a bad decision. So the story quietly reshapes itself: Downtown is the brand location, the others are just satellites. That framing protects the ego and buries the data.
None of this makes you a bad operator. It makes you human, and it is exactly why placement decisions need an external record that does not care which location you like. Your QR codes can be that record, because a scan is a scan whether it happens at the address you love or the one you were ready to close.
What QR Location Data Records That Your Instinct Cannot
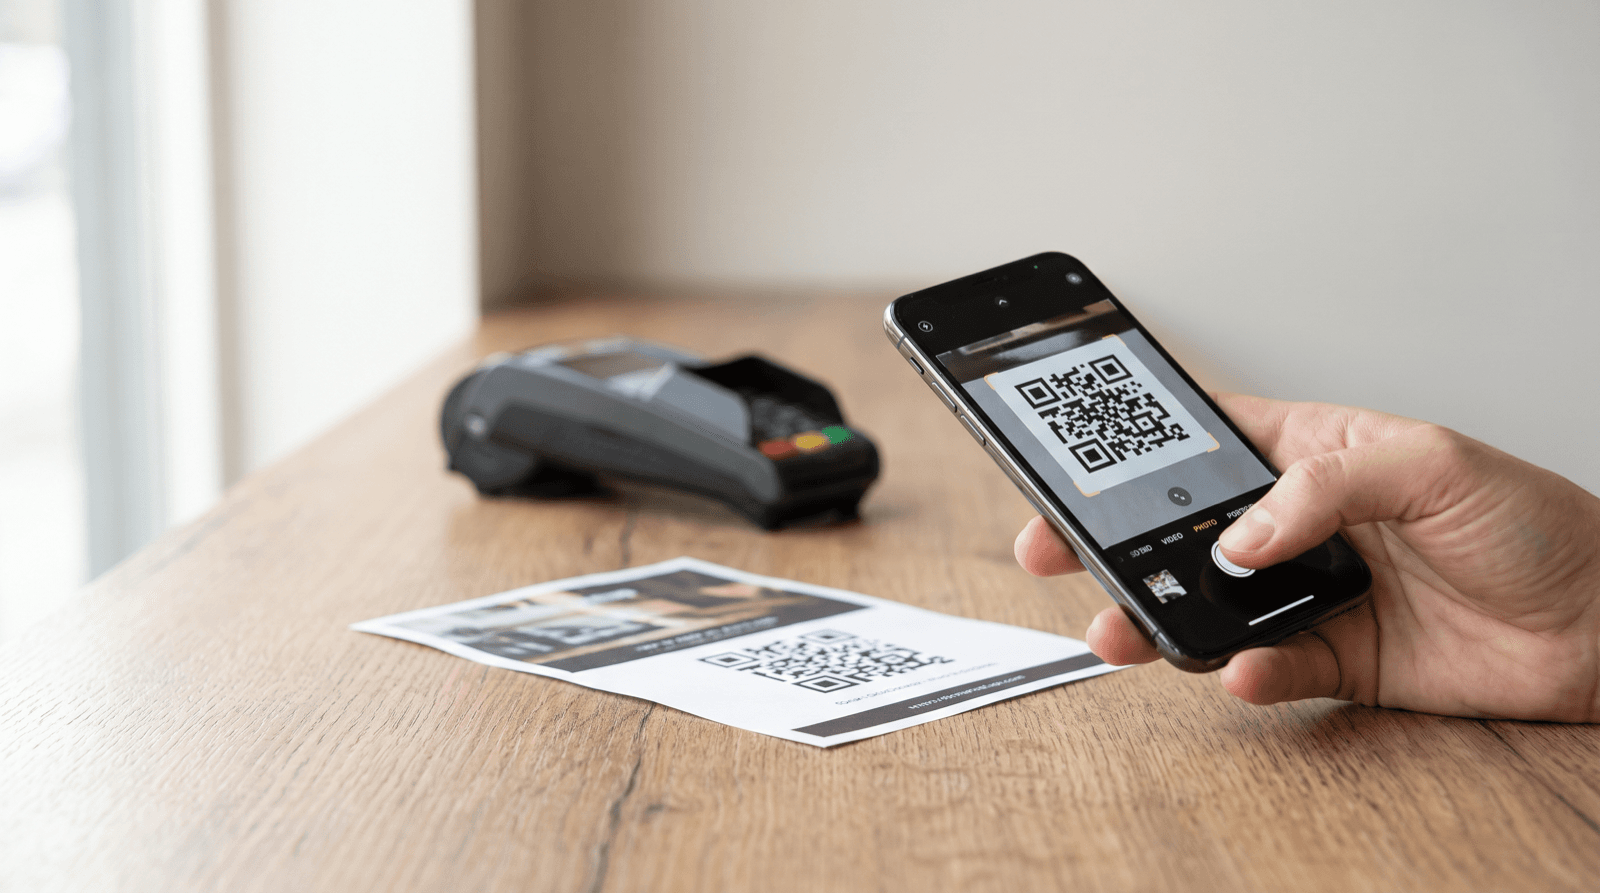
A scan is a timestamped, location-tagged, device-tagged event. That is the whole point. When someone scans a code at your suburban counter, the dynamic QR code behind it can log where the scan happened, what device made it, and what time it occurred, without anyone filling out a survey. On paid QRlytics tiers, that includes location, device, browser, and country data. Your memory cannot compete with that.
The key distinction is between a static QR code and a dynamic one. A static code hardcodes a fixed URL and cannot be changed after printing, which also means you cannot separate its performance from any other code pointing to the same page. A dynamic QR code uses a short redirect URL you control, so each location can carry its own code and its own measurement layer while still sending scanners to the same destination.
Scan tracking is a separate layer from the codes themselves. The code is the trigger; the tracking is what turns triggers into a dataset you can sort by location. Once you have that dataset, the Downtown-versus-suburban question stops being an argument and becomes a query.
This matters most at the decision stage, when you are choosing where to renew, where to expand, and where to pull back. Search Engine Land makes the point plainly for content, and it holds for operations too: the most defensible numbers are a byproduct of the business itself, not data you assembled to make a case. Your scan log is exactly that byproduct. It was not built to win an argument, which is what makes it trustworthy when it does.
Give Each Location Its Own Code, Not One Code for Everything
If every location shares a single QR code, you have thrown away the location decision before you started. Shared codes are simple, but they collapse all of your locations into one undifferentiated number. You will know your total scans and learn nothing about where they came from.
Three approaches cover most cases, and the right one depends on how granular your decision needs to be.
For a real Downtown-versus-suburban call, you need at minimum a unique code per location. It is the only setup that produces the comparison you actually want: scans and conversions attributed to a specific address, not a regional average that hides your best and worst performers inside the same figure.
Label codes clearly at creation, before they go to print. A code named 'store-north-window' six months from now is readable; a code named 'code_final_v3' is a mystery you will pay for later.
- Shared code across all locations: simplest to manage, zero per-location attribution. Use it only when you genuinely do not care which site drove the scan.
- Unique code per location: one dynamic code per address gives you hyper-local data and a clean per-location scan count. The cost is administrative, since you manage and label more codes.
- Unique code per print batch: useful for tracking which flyer run or window cling performed, though attribution gets murky once batches mix in the field.
Run the Numbers Yourself Before You Trust the Story
Here is a hypothetical worked example, with round numbers chosen only to show the method. Say Downtown records 1,000 scans in a month and 30 of those scanners complete the action you care about, whether that is a signup, a redemption, or a booking. That is a 3 percent scan-to-conversion rate: 30 divided by 1,000.
Now the suburban location. Say it records 300 scans in the same month and 27 conversions. That is a 9 percent scan-to-conversion rate: 27 divided by 300. Downtown produced more raw conversions, 30 versus 27, which is exactly why it feels like the winner. But the suburban code is three times as efficient at turning a scan into a customer.
That efficiency gap is the number your gut cannot see, because your gut counts crowds, not conversion rates. And efficiency is what tells you where an extra dollar of signage or an extra print run will pay off. Pouring more flyers into a 9 percent location compounds faster than feeding a 3 percent one.
The formula is deliberately simple, so run it on your own scan log rather than trusting any benchmark: conversions divided by scans, per location, over the same time window. Keep the window identical across locations, because a code that ran for three weeks against one that ran for one week is not a fair fight.
Once you have a rate per location, rank them. The ranking is often uncomfortable, and that discomfort is the signal you were missing. If the location you were ready to cut lands at the top, you just avoided an expensive mistake. If your favorite lands at the bottom, you now have a specific, testable reason to investigate rather than a vague feeling to defend.
Sample Size Is Where Most Location Calls Fall Apart
A rate means nothing until it rests on enough scans to be stable. Call a winner on 20 scans and you are reading noise. One unusually good afternoon, one staff member who pushes the code harder, one viral local post, and the number swings enough to reverse your ranking.
State the unknown plainly when it exists: if a location has only a handful of scans, you do not have a low performer, you have an unmeasured one. Those are different problems. A low performer needs a fix. An unmeasured location needs more time or more distribution before you judge it at all.
There is no single universal threshold, and it would be dishonest to invent one. The practical move is to hold each location to the same minimum scan count before you compare rates, and to watch whether the rate is still moving. If a location's conversion rate is swinging by several points week to week, it has not settled, and any decision you make on it is premature.
Time also confounds location. A code that launched in December against one that launched in July are running through different demand. Compare locations over the same calendar window whenever you can, and when you cannot, treat the comparison as directional rather than final. The goal is not a perfect experiment. The goal is a decision that is better than a hunch, backed by a number you can point to and a sample you are not embarrassed by.
Your Scan Log Is the One Asset a Competitor Cannot Copy
There is a strategic bonus to running location decisions on scan data: the data itself becomes an asset. According to Search Engine Land, publishing original numbers is the single most reliable lever for making a page stand out beyond its competitors, and almost every product now generates data worth publishing. Your scan log is original by definition. No competitor has it, and no amount of guessing reproduces it.
The scale of the underlying research is worth noting. According to Search Engine Land, On-Page.ai's information gain study scored 150 top-3 Google pages across 50 keywords and 10 verticals, grading each page from 0 to 100 on how much it added beyond the rest of its ranking cohort, judged by meaning rather than wording. The framing that came out of that work is simple: original evidence is what separates a page from the crowd, and the same logic applies to a business trying to separate a real insight from a repeated assumption.
For an operator, the takeaway is not about search rankings. It is that first-party measurement compounds. Every month of clean, per-location scan data makes the next decision sharper, because you are comparing against your own history instead of an industry average that may not describe your market at all.
This is the difference between running on borrowed benchmarks and running on your own baseline. Borrowed numbers tell you what happened to someone else. Your scan log tells you what is happening to you, at this address, with this audience, this month. When the two disagree, trust the one that was recorded at your own counter.
Read the Data Honestly, Not the Number You Were Hoping For
The final trap is subtle: once you have data, you can still cherry-pick the slice that confirms what you already believed. If Downtown loses on conversion rate but wins on total scans, the temptation is to quietly switch to the metric where it wins. Pick your decision metric before you look, and hold to it.
Segment before you conclude. A location that looks weak overall might be strong on mobile and weak on desktop, or strong at lunch and dead in the evening. Those segments point to fixes, not closures. Device, time of day, and day of week each hide stories that a single blended rate flattens.
Watch attribution carefully at the decision stage. A scan is the start of a journey, not the end, and the action you count as a conversion has to be the one that matters to the business, not the one that is easiest to record. If you measure signups but revenue lives in repeat visits, you may be optimizing the wrong step.
None of this requires a data team. It requires the discipline to define the question, pull the per-location numbers, and accept the ranking even when it contradicts the location you love. The codes do not have a favorite. That is their entire value.
Your gut is not useless. It is just running on the locations you see most, not the ones your customers convert at. QR location data closes that gap by recording every scan where it happens, so the Downtown-versus-suburban question becomes a query instead of an argument. This week, pick your two or three locations, assign a unique dynamic code to each if you have not already, and label them clearly. Give them the same time window, then compute conversions divided by scans for each. Rank them. If the ranking surprises you, resist the urge to explain it away, and instead test one variable at your weakest measured location. Let the next month of scans, not your instinct, tell you whether you were right.
Start measuring your own campaigns
QRlytics tracks every scan with location, device, and browser data, so you can see which printed pieces actually pay off. The free plan covers your first codes at no cost, and Pro unlocks unlimited dynamic codes and full scan history when you are ready to scale. See all options on the plans page.

Ready to track your QR codes?
Create trackable QR codes with powerful analytics. See who scans, when, and where. All in real-time. Get started for free today.