
Do your table tents actually get scanned?
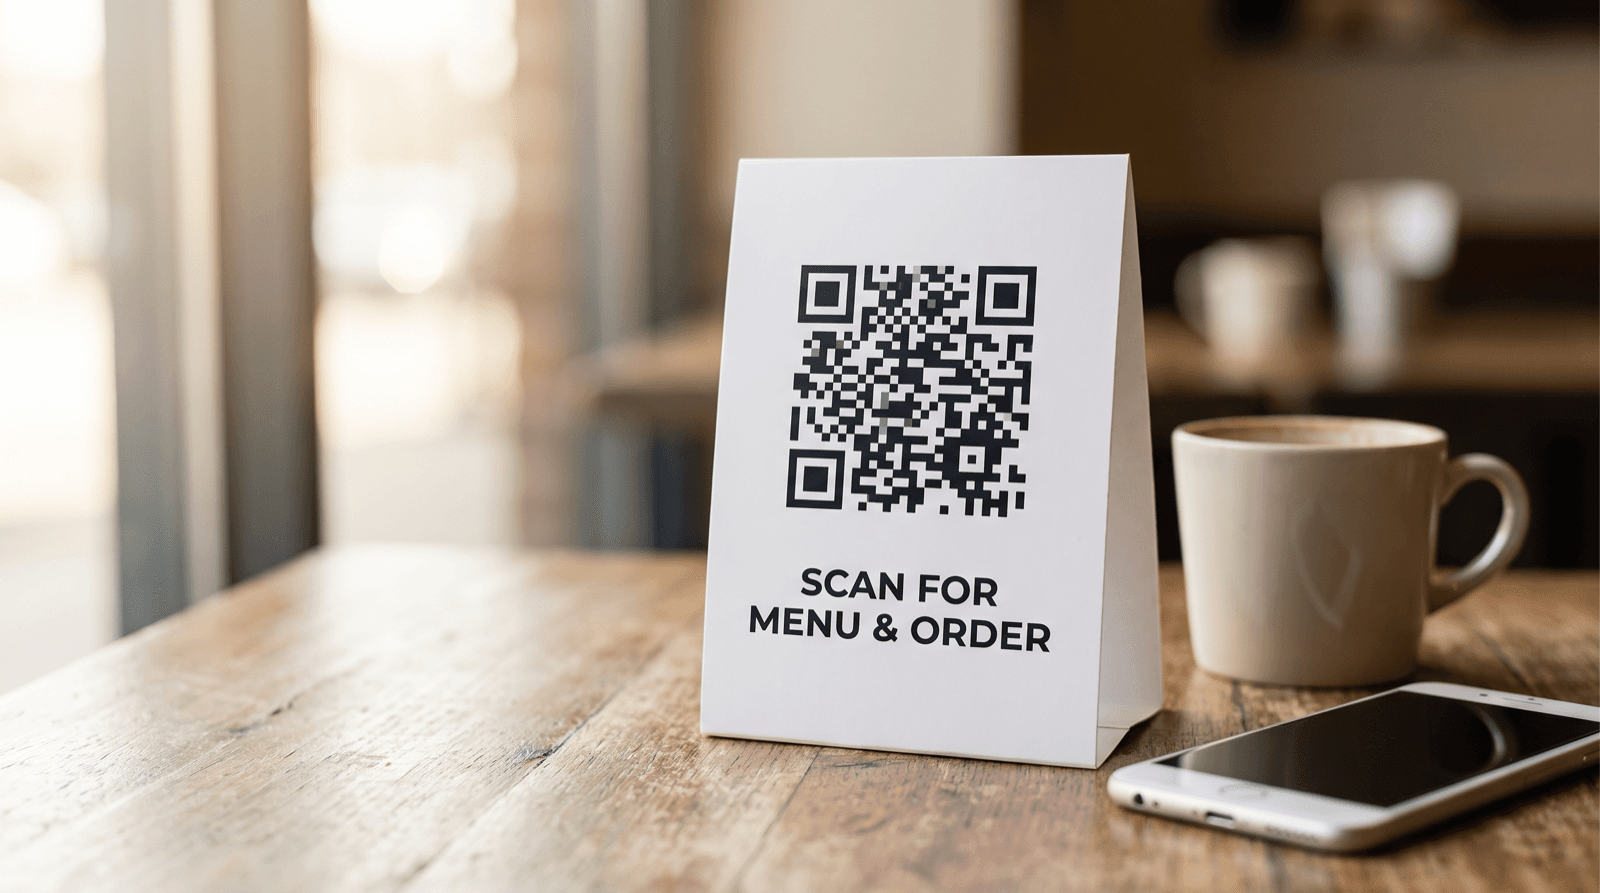
The table tent sits on every table in your cafe: folded cardboard, a QR code, and a cheerful line like 'Scan for our loyalty club.' It has been there for six weeks. Here is the question almost no operator can answer: how many people actually scanned it? Not how many walked past, not how many could have, but how many phones lifted, framed the code, and landed on your page. QR code table tents are one of the most common phygital placements in hospitality, and one of the least measured. This article walks through how to find out whether yours earn their real estate, and how to test your way to a better number.
Why 'It Probably Works' Is Not an Answer
A static QR code prints a fixed link and tells you nothing after it leaves the printer. You cannot see a single scan, so 'it probably works' is the best answer you get. A dynamic QR code routes through a short redirect URL you control, which means every scan becomes a timestamped event: when it happened, roughly where, and on what device. That measurement layer, scan tracking, is separate from the code itself, and it is the only reason any of the questions in this article have answers.
Most table tent programs skip this step entirely. The code goes to print, the tents go on the tables, and the loop never closes. Nobody counts. When the quarterly review asks whether the loyalty club is growing, the honest answer is a shrug. You cannot improve a number you never wrote down.
The fix is not complicated. Put a dynamic code on the tent, watch the scans accumulate day by day, and you have turned a decoration into an instrument. Everything that follows depends on that one change, because a table tent you cannot measure is a table tent you cannot improve.
Set a Baseline for Your QR Code Table Tents
Before you redesign anything, you need a starting number. A baseline is the scan performance of your table tents exactly as they are today, measured over a fixed window. Without it, any change you make is a guess dressed up as a decision.
Here is the arithmetic, with round hypothetical numbers so the method is clear. Say your cafe served 1,000 customers last week and your table tent code logged 50 scans. That is a 5 percent scan rate. Those figures are illustrative, not an industry benchmark; the value is the formula, scans divided by customers served, tracked over a set period. Run it for at least a full week so you capture weekday and weekend traffic, which behave differently.
Write the baseline down and date it. Every test from here on measures against that line. If a new version pushes the rate from 5 percent to 7 percent, you know the change earned two points. If you never recorded the 5 percent, that same result is just a number floating without meaning.
Test One Thing at a Time, or Learn Nothing
A/B testing only works when you start with a clear hypothesis. According to MarketingProfs, guesswork burns budget, and every test needs a stated reason before it runs: a specific idea about what will change and why. 'Add a coffee icon and the scan rate rises because people grasp the offer faster' is a hypothesis. 'Make the tent better' is not.
The discipline that makes this pay off is changing one variable at a time. If you rewrite the headline, swap the code color, and move the tent to the edge of the table all in the same week, a jump in scans tells you nothing about which move did the work. You are left guessing again, which is where you started. Hold everything steady except the single element you are testing.
Pick variables you actually control and can describe in one line: the call-to-action copy, the code size, the contrast between the code and its background, or the position of the tent on the table. MarketingProfs frames the same rule for landing pages, test elements you control, and it transfers cleanly to a piece of folded cardboard.
How Many Scans Before You Trust the Result?
A test that ends too early is worse than no test, because it hands you a confident answer that happens to be wrong. The real question is how many scans you need before a difference between two table tents means something.
According to MarketingProfs, a sample-size calculator takes three inputs: your baseline conversion rate (say 5 percent), the minimum detectable effect you care about (a 10 percent lift would move 5 percent to 5.5 percent), and your desired statistical significance, usually 95 percent. Plug those in and the calculator returns how many observations, in your case scans against customers served, each version needs before you call it.
The practical consequence for a small cafe is patience. Low-traffic locations accumulate scans slowly, so a table tent test runs for weeks, not days. Calling a winner on day two because the line is climbing means you have mistaken a random swing for a real effect. Fix the sample size before you start, and refuse to peek at the winner until you reach it.
Rank Your Table Tent Ideas Before You Print Them
You will have more ideas than you can test. Bigger code, brighter color, a free-cookie offer, a different call to action, a rigid stand instead of a fold. Running all of them at once is impossible, and running them in a random order wastes the slow scan traffic you have. Rank first.
MarketingProfs recommends the PIE framework to decide what to test first: Potential (how much lift the change can drive), Importance (whether it aligns with business goals), and Ease (whether you can implement it quickly). Score each idea on the three and the front of the queue picks itself.
Search Engine Journal frames the same triage as three questions for every experiment: how big is the win if it lands, how sure are you going in, and what will it cost to run. Cheap, high-confidence, high-upside ideas go first. The idea a competitor tried, or the one you saw on a design blog, waits in line unless it clears the same bar.
- Potential: how much can this change lift your table tent scan rate?
- Importance: does a higher scan rate move a real goal, like loyalty signups or reorders?
- Ease: can you print and deploy the change on your tables this week?
More Tests Is Not More Learning
There is a temptation, once you can print a new table tent design in an afternoon, to run a dozen at once and feel productive. Search Engine Journal makes the counterintuitive case that the cheaper tests get to run, the harder your framework should be to pass. Volume was never the constraint. Telling a real result from random noise was, and printing faster does not solve that.
A backlog of dozens of ideas is not a strategy; it is a way to stay busy while the tests that matter wait their turn. Search Engine Journal's advice is to shrink the backlog, not feed it: choose the few tests that count this quarter and say no to the rest out loud, where your team can hear it. For a table tent program that might mean two tests this quarter, run properly, instead of ten run halfway.
The discipline nobody enjoys is killing a good-sounding idea before it eats three weeks of slow scan traffic. If a version is not winning by the sample size you set, retire it and move on to the next ranked bet.
A Scan Is Not the Finish Line
For a bottom-of-funnel program, the scan is the start of the journey, not the end of it. A table tent that earns scans but drives no loyalty signups has an attractive code and a broken destination. Track the full path: scan, then landing page, then the action you actually want, whether that is a club signup, a reorder, or a review.
MarketingProfs is blunt about vanity metrics: more clicks mean nothing if they do not turn into conversions. The same holds for scans. Set a measurable goal in SMART terms, for example increase loyalty signups from table tents by 20 percent in four weeks, not the vague 'get more members.' A specific, time-bound target tells you whether the tent is doing its job.
This is where scan-to-submission conversion becomes the number that matters. If 50 scans produce 5 signups, that is a 10 percent scan-to-signup rate (round hypothetical figures again). Improving that rate can outperform chasing raw scans, because it works on traffic you already have instead of demanding more of it.
Not Every Table Behaves the Same
One table tent design measured as a single blended number hides more than it reveals. The window seats catch different customers than the back corner; the lunch rush behaves differently from the dinner crowd. MarketingProfs makes segmentation a core step, because different segments behave differently and what works for one group can flop for another.
You can build that segmentation directly into the hardware. Give each zone or each daypart its own dynamic code and you can compare scan rates side by side instead of averaging them into mush. A unique code per placement costs a little more admin, and it buys you hyper-local data: which tables earn scans and which are dead weight taking up space.
Segmentation pays off across marketing, not just on cardboard. MarketingProfs cites an Aimers case study in which combining paid search and conversion work with precise audience segmentation cut unqualified leads by 57 percent for Upper Hand, and notes that Airbnb lifted mobile bookings by streamlining its checkout flow. The mechanism is identical on a table tent: stop treating every scanner as the same person, and the useful patterns surface.
Table tents do not have to be a hopeful decoration. Put a dynamic QR code on them, record a baseline scan rate this week (scans divided by customers served over a full seven days), and you have replaced a shrug with a number. This week: pick your single highest-scoring idea from a PIE ranking, change that one variable on half your tables, keep the rest as a control, and fix in advance how many scans each version needs before you decide, following the sample-size inputs MarketingProfs lays out. Then wait for the number, not the hunch. Operators who measure their table tents are not smarter than the ones who do not; they simply refuse to guess when a scan counter is sitting right there.
Start measuring your own campaigns
QRlytics tracks every scan with location, device, and browser data, so you can see which printed pieces actually pay off. The free plan covers your first codes at no cost, and Pro unlocks unlimited dynamic codes and full scan history when you are ready to scale. See all options on the plans page.

Ready to track your QR codes?
Create trackable QR codes with powerful analytics. See who scans, when, and where. All in real-time. Get started for free today.